
| The longest government shutdown in history ended on November 12, 2025 –. As people were called back to work, there were a lot of questions as to how much the 43-day shutdown would impact the economy. According to the Congressional Budget Office (CBO), the disruption is expected to reduce fourth-quarter GDP growth by about 1.5 percentage points. All in all, tens of thousands of federal workers missed paychecks, contractors lost business, consumer spending was curtailed during the six-week interruption, and key data like jobs and unemployment, inflation, retail sales, etc., were not released as planned because the workers who tabulate the data were furloughed. Investors are anxious about how consumers will behave after six weeks of disrupted pay and routines. Many of those wages are lost (or delayed) and won’t get recycled instantly into restaurant meals, travel, shopping, etc. That means some spending is permanently displaced this quarter. That, in turn, is one reason stocks faltered despite the end of the shutdown.
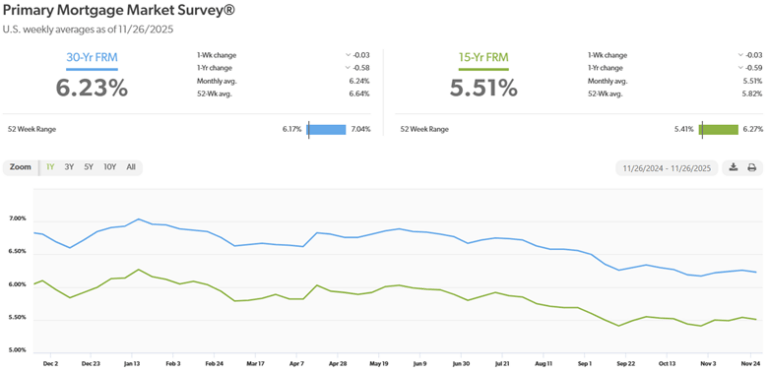
U.S. Treasury Bond Yields – The 10-year U.S. Treasury bond yield closed the month at 4.02%, down from 4.11% on October 31, 2025. The 30-year treasury yield ended the month at 4.67%, unchanged from 4.67% on October 31, 2025. We watch bond yields because mortgage rates often follow treasury bond yields.
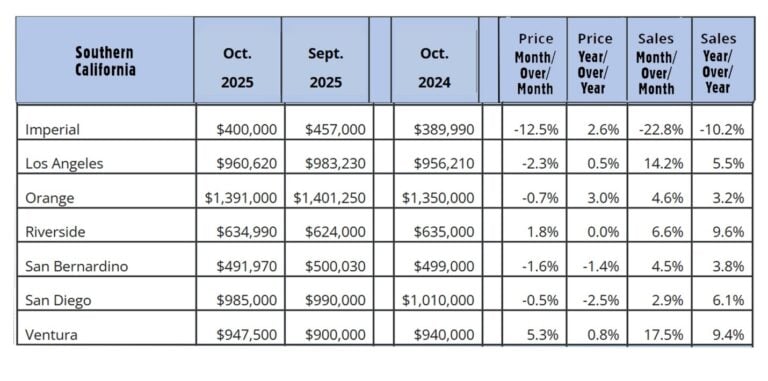
U.S. existing-home sales – October 2025 – The National Association of Realtors reported that existing-home sales totaled 4.10 million units on a seasonally adjusted annualized rate in October, up 1.2% from the number of homes sold in September and up 1.7% from the number of homes sold last October. The median price paid for a home sold in the U.S. in October was $415,200, up 2.1% from $406,800 one year ago. There was a 4.4-month supply of homes for sale in October, up from a 4.1-month supply last October. First-time buyers accounted for 32% of all sales, up from 30% last month. Investors and second-home purchases accounted for 16% of all sales, down from 15% in August. All cash purchases accounted for 39% of all sales, up from 30% last month. Foreclosures and short sales accounted for 2% of all sales California existing-home sales – The California Association of Realtors reported that existing-home sales totaled 285,590 on an annualized basis in October, up 1.9% from 277,410 in September. Year-over-year sales were up 4.1% from a revised 271,370 annualized home sales last October. The statewide median price paid for a home in was $886,960 in October, down 0.2% from 888,740 in October 2024. The unsold inventory index showed that there was a 3.1-month supply of homes for sale in October. These numbers are a little deceiving. Prices have dropped more than the median price indicates. The median price is the midpoint of all homes sold. Basically, it’s the point where one half of the homes sold for more and one half of the homes sold for less. Usually, the median price is a good indicator of prices across the board. There are times when conditions impact that. This is one of those times. With stock market values at all-time highs, which they were in October, people who invested in the stock market are flusher than people who are not. Additionally, many of the factors that impact people’s ability and desire to buy a home affect people more in the lower income range than they affect people in higher income ranges. That’s happening now. Sales are down in all price ranges compared to any time prior to interest rates rising in mid-2022, but sales in the lower price ranges as a percentage of all sales are fewer than we would normally see, as those people are more impacted by inflation, don’t have stocks, etc. The graph below shows CAR sales data by county for Southern California.
|