
The economy continued to pick up steam in July – Although stock markets ended the month off their record highs set in the third week of July, stocks are still up significantly from their April lows. For example, the Nasdaq is up 36% from its April low of 15,587, and the S&P is up 24% from 5,074 on April 4. The U.S. economy rebounded strongly from the first quarter. The Gross Domestic Product (GDP) was -0.5% in the January to March 2025 quarter, a sign that the country may have been entering into a recession, which is defined by two consecutive quarters of negative growth. In the second quarter, from April to June 30, GDP jumped to 3%. That is an incredible turnaround. The job market has been strong as well. Both May and June hiring were well above expectations. We will get the July jobs report on Friday, August 1st.
Tariff update – President Trump announced that he has reached trade deals or the framework of trade deals with the European Union, South Korea, Japan, Indonesia, the Philippines, the United Kingdom, Vietnam, Thailand, and Cambodia. A partial framework has been discussed with China. Malaysia, Mexico, South Africa, and India have been granted temporary reprieves from the August 1, 2025, deadlines.
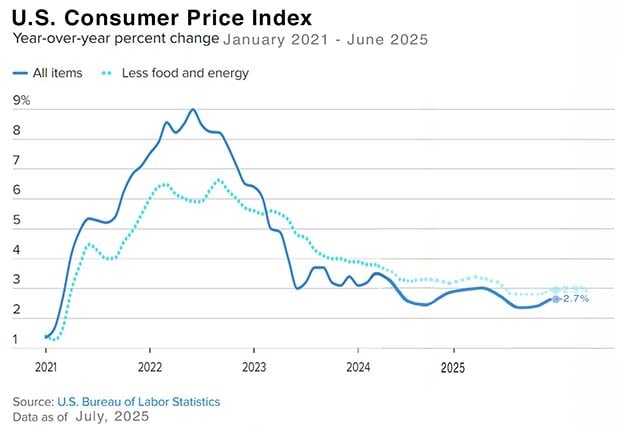
Inflation increased in June – The Consumer Price Index (CPI) jumped to an annual increase of 2.7% in June. That is up from 2.3% in April, its lowest reading since early 2021, and 2.4% in May. Core CPI, which excludes volatile costs like food and energy, was up 2.9% year-over-year, up from 2.8% in May. We have been closely following the inflation data because it has a direct correlation to interest rates. The Fed has put off interest rate reductions in fear that tariffs will lead to higher prices for consumers. As the Fed expected, after dropping steadily since peaking in 2022, inflation is now showing signs of heating up again. The Personal Consumption Expenditures (PCE)report, the Fed’s preferred measure of inflation, jumped as well. Month-over-month headline PCE jumped 0.3%, up from 0.2% in May, and reached a 2.6% year-over-year increase, up from a 2.4% year-over-year increase in May. That marked its highest inflation level since February.
The Federal Reserve held rates steady in July – With inflation indexes showing that inflation is picking up, GDP growth jumping, and the job market strong, the Fed decided not to drop interest rates in July despite pressure from President Trump to do so.
Stock markets ended the month near record highs – The Dow Jones Industrial Average ended the month at 44,230.98, up 0.3% from 44,094.77 on June 30, 2025. The Dow is down 0.7% year-to-date. The S&P 500 closed the month at 6,339.34, up 2.2% from 6,204.95 on June 30, 2025. It is up 5% year-to-date. The NASDAQ closed at 21,122.45, up 8.6% from 20,369.73 on June 30, 2025. It is up 7.6% year-to-date.
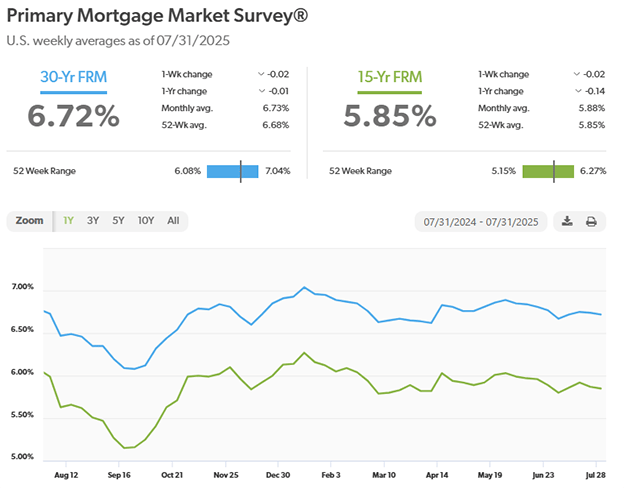
Mortgage rates – Every Thursday Freddie Mac publishes interest rates based on a survey of mortgage lenders throughout the week. The Freddie Mac Primary Mortgage Survey reported that mortgage rates for the most popular loan products as of July 31, 2025, were as follows: The 30-year fixed mortgage rate was 6.72%, down from 6.77% last month. The 15-year fixed was 5.85%, down from 5.89% last month.
The graph below shows the trajectory of mortgage rates over the past year.
U.S. existing-home sales stalled in June 2025 – The National Association of Realtors reported that existing-home sales totaled 3.93 million units on a seasonal annualized rate in June, down 2.7% from an annualized rate of 3.93 million units in May. The median price paid for a home sold in the U.S. in June was $435,300, up 2%from $426,900 one year ago. There was a 4.7-month supply of homes for sale in June, up from a 4-month supply in June 2024. First-time buyers accounted for 30% of all sales. Investors and second-home purchases accounted for 16% of all sales. All cash purchases accounted for 29% of all sales. Foreclosures and short salesaccounted for 3% of all sales
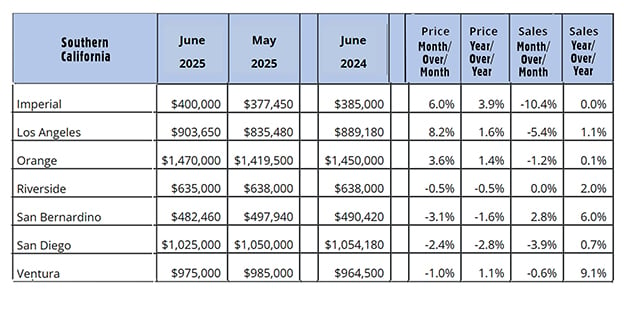
California existing-home sales – The California Association of Realtors reported that existing-home sales totaled 264,260 on an annualized basis in June, up 4% from 254,190 in May. Year-over-year sales were down 0.3% from a revised 264,960 annualized home sales last June. The statewide median price paid for a home in was $899,720 in June, down 0.1% from $900,720 in June 2024. There was a 3.8-month supply of homes for sale in June, up from a 3-month supply of homes for sale one year ago.
The graph below lists home sales data by county in Southern California.